Statistics and NRA accuracy testing.
The NRA most frequently tests accuracy with a set of five, 5-shot groups.
Group size, the accuracy measure, is the center distance between the two furthest-apart holes in the target, in each group.
With the assumption that shot location is distributed NORMAL, the ratio of largest group / smallest group has been calculated for both shots / group and number of groups per set.
For example, sets of five, 5-shot groups have the largest / smallest ratio = 1.91, the average over many sets.
This ratio is due to random NORMAL variation alone, other effects such as wind and shooter ability would increase the ratio.
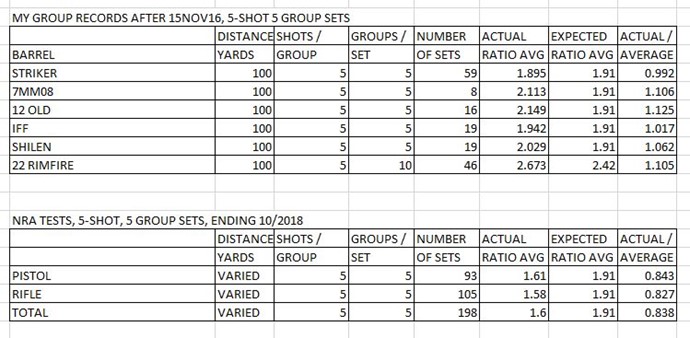
My center fire 5-shot average ratio for 121 sets of five, 5-shot groups is 1.97. The expected ratio is 1.91. Actual / expected = 1.97 / 1.91 = 1.03.
My rimfire 10-shot average ratio for 45 sets of ten, 5-shot groups is 2.69. The expected ratio is 2.42. Actual / expected = 2.69 / 2.42 = 1.11.
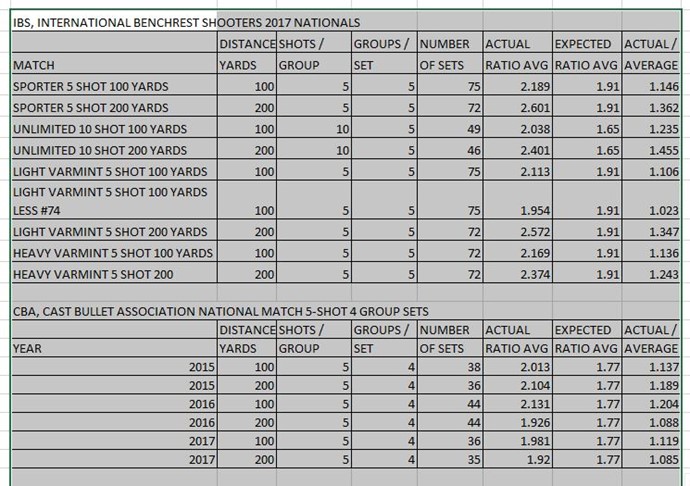
The Cast Bullet Association National Match results, 2015, 2016, 2017; sets of four, 5-shot groups, (rifle):
100 yards, 118 sets of four groups, actual ratio = 2.05, expected ratio = 1.77, actual / expected = 1.16.
200 yards, 115 sets of four groups, actual ratio = 1.98, expected ratio = 1.77, actual / expected = 1.11.
The NRA, American Rifleman, 198 sets of five group 5-shot tests ending in October 2018:
Pistol, 93 sets of five groups, actual ratio 1.61, expected ratio = 1.91, actual / expected = .84.
Pistol, 105 sets of five groups, actual ratio 1.58, expected ratio = 1.91, actual / expected = .84.
I can think of no reason that NRA actual / expected ratios would have a large-sample, (198), value LESS than 1; and can think of many reasons why it might be GREATER than 1.
I consider the NRA results to be suspect-perhaps false.


