Larry Gibson
posted this
05 January 2016
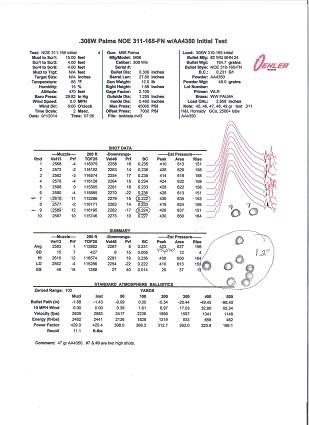
That has long been a standard for cast bullets. As mentioned in Chapter 1, the cases for all three rifles were fire formed to the specific rifles and “match prepped” as such. The primers used are WLRs. Two powders were used. H4895, a medium burning powder, was used with a Dacron filler in 2 gr increments from 26 gr to 38 gr. This was expected, and did, to give velocities from 1700 fps or so up through 2500 fps.
The second powder tested was H4831SC, a slow burning powder, loaded in 2 gr increments from 40 to 46 gr to give from 90 to 100% loading density. The only sorting done with the 311291 bullets were to inspect them for wrinkles, voids of non fillout. None were weighed for segregation by weight.
The gas checks used were Hornady". They were pre-seated with the Lyman GC seater on a Lyman 450 with the .311 H die and then lubed in the .310 H die. The lube used was Javelina. At no time during the test was there any indication of leading or “lube failure". All told in Test 1 I fired 75 shots for record plus 10 foulers through each rifle for a total of 250 shots. After returning home it seemed a daunting task to sort through the data, measure groups and put it into some format that is easily presented on this forum. I could list all sorts of numbers in various manners but that would just get confusing. From the listed data the M43 provides on each shot plus the averages let me tell you I've got lots of numbers! I decided instead to put the pertinent data onto graph form.
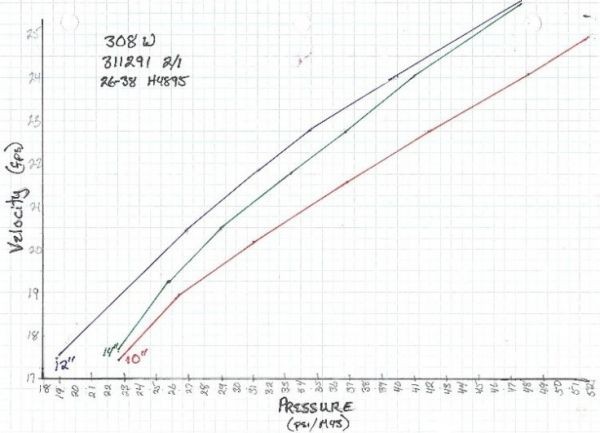
That is a “visual" way to present information and it gives valid comparisons which are easy to see and make comparisons from. It is easy enough to pull additional information of the graphs if you want it. However the little squares of the graph did not scan well so if you want some specific information don't hesitate to ask. I couldn't get the graph on this computer to work right so I resorted to graph paper and hand plotted them. Without further ado we might as well get to the meat and potatoes of this test . Graph #1 is a comparison of velocity and pressure. There was considerable consternation from some forum members that pressures would not be “exact” between the rifles. I stated that, disregarding the fact that there is always variation of pressures, even with the same load in the same rifle; the pressures need not be the same in each rifle. In fact they were not. When we graph out the velocity/pressure of the same increasing loads out of different rifles what we expect to see is a linear relationship between them. The linear lines for each (red = 10” twist, blue = 12” twist, green = 14” twist) should run fairly parallel. This gives us a valid comparison of the time pressure curves of each rifle with the other rifles time pressure curves. That's exactly what we see in graph #1. As the pressure increases the velocity increases pretty close for the 10 and 12&” twist rifles but the 14” had some problems. We also see a slight divergence as velocity increases. This is expected as the 12 and 14"; twist barrels were longer than the 10” twist barrel so velocity increased more as pressure was increased. Thus the comparison between the rifles is valid as the linear progressions are close to the same. Were one of them radically different then it would be obvious a comparison wasn't valid. However there is a slight anomaly with the 14” twist. We could pontificate as to why and probably come up with numerous reasons, most of which would probably be wrong. So let's what the data can tell us regarding that anomaly.
Concealment is not cover.........