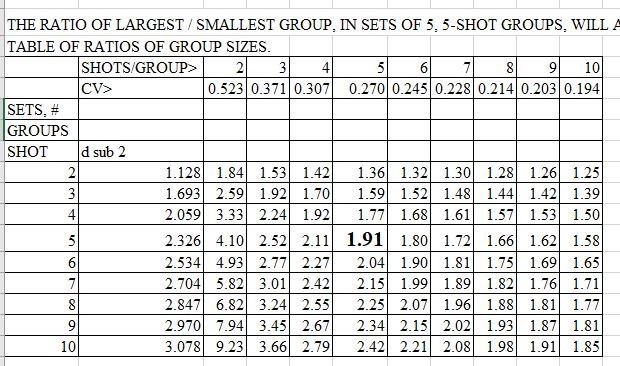
The ratio of largest/smallest groups in sets of groups varies with shots / group and number of groups per set.
Based on Normal distribution of group size:
The ratio of largest/smallest groups in sets of groups varies with shots / group and number of groups per set.
Based on Normal distribution of group size:
Attached Files
the ratio of largest group / smallest group, for sets of 5, 5-shot groups, will average 1.91.
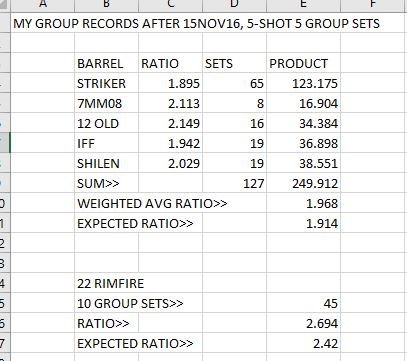
My records show:
Attached Files
Pretty close to the expected values.
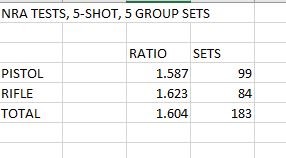
American Rifleman test records:
Attached Files
The NRA ratios are smaller than the expected ratio, a lot smaller.
I suspect the NRA test results.
Attached Files
I suspect the NRA of "cherry picking" five of an unknown number of groups to sell advertising. In the last 30 years they never tested a gun they didn't like.
Attached Files

Thanks Joe. I have been wondering what the variation of other than five shot groups looks like.
I think it is human nature to assume that a rifle will (or should) shoot groups of about the same size time after time. As the above clearly shows, that isn't even close to true. How many times have you heard "my rifle will shoot groups of about an inch all day long". You don't have to shoot all day to find that this isn't true. This misunderstanding makes a practical difference in our efforts to improve rifle accuracy.
For instance, it tempts us to draw conclusions on what does or doesn't improve accuracy in trying to find best loads by comparing a string of single groups, a worthless procedure with three shot groups, a near worthless procedure with five shot groups, and only a little better with ten shot groups.
The normal variation in groups sizes also makes us think that the problem is "flyers" in the larger groups while they are usually just part of normal variation. This this usually false assumption makes us think there must have been something wrong with the individual shot and leads us into such foolishness as minute sorting of bullets, and cases by weight and magnifying glass instead of understanding that groups just naturally vary quite a bit. It may also lead the shooter to believe that those fliers (that magically appear as only as one per group -- THINK ABOUT THAT AMAZING FACT) are caused by mistakes by the shooter that he somehow doesn't make for the small groups in the string.
It seems to me that any serious and intelligent shooter needs to have at least a rough handle on the variation in group sizes shown in Joe's table to help us reduce the foolish things we all do sometimes.
Aside from that it is just plain interesting as another example how nature doesn't care what we may think about how things should be but has her own ideas and variation of group sizes is an example.
John
Attached Files
Joe and John
I agree that this is important math for what we do. However, often we are comparing two loads and hence two group averages. If we focus on the best group for a moment, the tail of the distribution of possible group sizes which extends to the even smaller groups is of little consequence to us. We only care about the possibility that our actual average is larger than the sample average. Likewise we only care about the chance that the real average for the larger group size could actually be smaller than calculated. My point is if we are comparing two loads, the actual comparison is not as hopeless as the +/- 30% figure (while correct for sure) makes it seem. The important comparison is of the + dispersion of the small group vs the - dispersion for the larger group. Of course the mathematics for this comparison also exists and while it would be a more complicated calculation, I highly suspect Joe is proficient at it.
Just thinking out loud while I wait for the game to start.
Jim
Attached Files
Ric ..... i noticed the Rifleman got soft about the time Ed Harris abandoned ship .... wonder if there is a connection .... still waiting on a reply from my witty letter to tanya metaska ...
... and yes i am a lifer at the NRA ...
ken
Attached Files
great stuff, joeb ... thanks .... stuff we might have feared, but don't want to admit ... heh ...
*****************
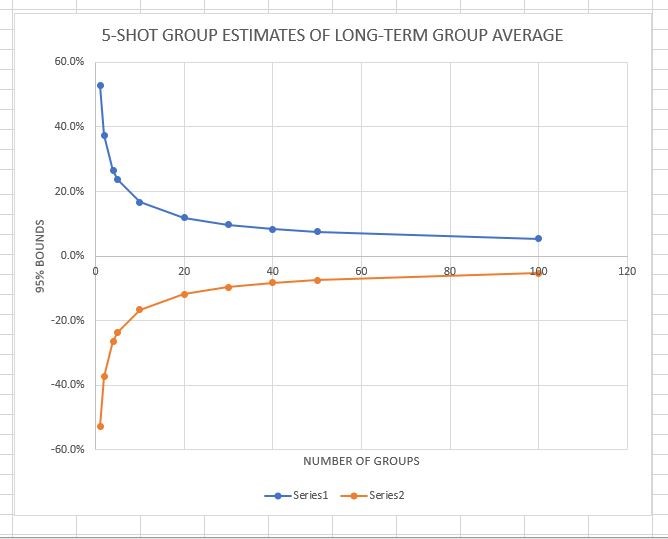
hey, how about a pretty graph showing the observed group sizes approaching the expected group size line as number of shots goes to ... say ...1000 ... 5000 shots. ? or maybe what would fit on a page ...
***********
one of my favorite quotes was from one of my students ( albert einstein ) when he wondered "" did god have a choice ?? "" ..... i think it applies to statistics ...
ken
Attached Files
great stuff, joeb ... thanks .... stuff we might have feared, but don't want to admit ... heh ...
*****************
hey, how about a pretty graph showing the observed group sizes approaching the expected group size line as number of shots goes to ... say ...1000 ... 5000 shots. ? or maybe what would fit on a page ...
***********one of my favorite quotes was from one of my students ( albert einstein ) when he wondered "" did god have a choice ?? "" ..... i think it applies to statistics ...
ken
Like this?
Attached Files
great stuff, joeb ... thanks .... stuff we might have feared, but don't want to admit ... heh ...
*****************
hey, how about a pretty graph showing the observed group sizes approaching the expected group size line as number of shots goes to ... say ...1000 ... 5000 shots. ? or maybe what would fit on a page ...
***********one of my favorite quotes was from one of my students ( albert einstein ) when he wondered "" did god have a choice ?? "" ..... i think it applies to statistics ...
ken
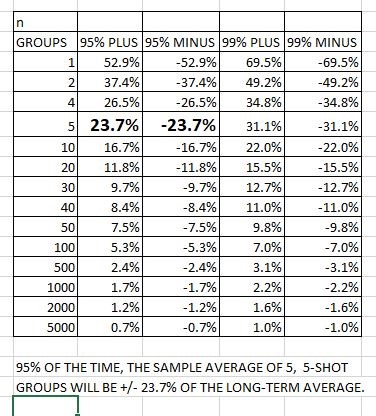
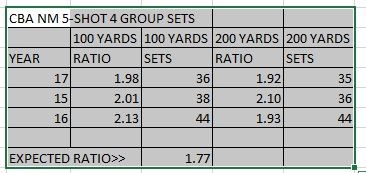
The table:
Attached Files
CBA NM 5-SHOT 4 GROUP RATIOS, 15, 16, 17. THERE LOOKS TO BE A LOT OF 1 SHOT WILD GOING ON.
Attached Files
 wimilkman
30
wimilkman
30
 Tom Acheson
22
Tom Acheson
22
 pat i.
18
pat i.
18
 Aaron
13
Aaron
13
 BRatigan
10
BRatigan
10
 MarkinEllensburg
9
MarkinEllensburg
9
 Ed Harris
8
Ed Harris
8
 porthos
7
porthos
7
 mashburn
6
mashburn
6
 joeb33050
4
joeb33050
4